
BMI Calculator by Age – Check Your Healthy BMI Range
Your BMI, or body mass index, is one of the most widely used tools for assessing body weight relative to height. But here’s what many people miss: a BMI calculator by age gives you a more accurate picture of what a healthy weight actually looks like for you specifically, because your body changes significantly over the decades.
BMI measures your weight in kilograms divided by your height in meters squared. It gives you a simple number that places you into one of four categories: underweight, normal weight, overweight, or obese. That number helps doctors, nutritionists, and fitness professionals quickly identify potential weight-related health risks.
Age matters because body composition shifts throughout life. A 25-year-old and a 65-year-old with the exact same BMI are not in the same health situation. Muscle mass declines, fat distribution changes, and metabolism slows. Using an age-aware BMI Calculator helps you understand your number in the right context.
A healthy BMI range by age is generally 18.5 to 24.9 for adults 20 and older. For adults over 65, a slightly higher range of 22 to 27 may be healthier. Children and teens use age- and sex-specific BMI percentile charts instead of fixed ranges.
BMI Calculator by Age
Use the calculator below to find your BMI instantly. Enter your age, height, and weight, then choose your unit system. You’ll get your BMI score, weight category, and an age-adjusted healthy range recommendation.
BMI Calculator by Age
Metric & Imperial · Age Adjusted Results
What Is BMI?
BMI stands for Body Mass Index. It’s a numerical value calculated from your weight and height. The World Health Organization (WHO) and most health systems worldwide use it as a standard screening tool to classify weight status in adults.
The value itself does not directly measure body fat. Instead, it estimates whether your weight is proportionate to your height. Doctors use it as a first-step indicator of potential weight-related health risks, including cardiovascular disease, type 2 diabetes, and certain joint conditions.
Simple Screening Tool
BMI gives a quick, cost-free estimate of weight status without needing lab tests or specialized equipment.
Widely Used by Clinicians
Doctors, nurses, and dietitians use BMI as part of routine health checks alongside other measurements.
Population-Level Data
BMI is based on data from large population studies, making it a reliable reference point across diverse groups.
First-Step Assessment
It doesn’t replace a full health assessment but helps flag when further investigation may be needed.
Anyone can use a BMI calculator — adults looking to manage weight, fitness beginners tracking progress, people preparing for a doctor’s visit, or individuals monitoring long-term health trends. Pairing it with tools like a Body Fat Calculator and a Waist to Height Ratio Calculator gives you a more complete health picture.
How BMI Is Calculated
The math behind BMI is straightforward. There are two formulas depending on whether you use metric or imperial measurements.
Metric Formula
Metric System (kg and cm)
BMI = weight (kg) ÷ [height (m)]²
Example: Weight = 70 kg, Height = 1.75 m
BMI = 70 ÷ (1.75 × 1.75) = 70 ÷ 3.0625 = 22.86
Imperial Formula
Imperial System (lbs and inches)
BMI = [weight (lbs) ÷ height (in)²] × 703
Example: Weight = 154 lbs, Height = 69 in (5’9″)
BMI = [154 ÷ (69 × 69)] × 703 = [154 ÷ 4761] × 703 = 22.75
Once you have your BMI number, you compare it to standard ranges. These ranges apply to adults aged 20 and older. For children and teenagers, age-specific percentile charts are used instead. Our BMI Calculator handles all of this automatically.
| BMI Range | Category | Health Risk |
|---|---|---|
| Below 18.5 | Underweight | Moderate |
| 18.5 – 24.9 | Normal Weight | Minimal |
| 25.0 – 29.9 | Overweight | Increased |
| 30.0 – 34.9 | Obese Class I | High |
| 35.0 – 39.9 | Obese Class II | Very High |
| 40.0 and above | Obese Class III | Extremely High |
BMI Age Chart
The table below shows how the healthy BMI range is interpreted across different age groups. While the standard adult BMI scale applies from age 20 onward, the context of what is considered healthy shifts slightly as you get older. Use this age BMI chart alongside your calculator results.
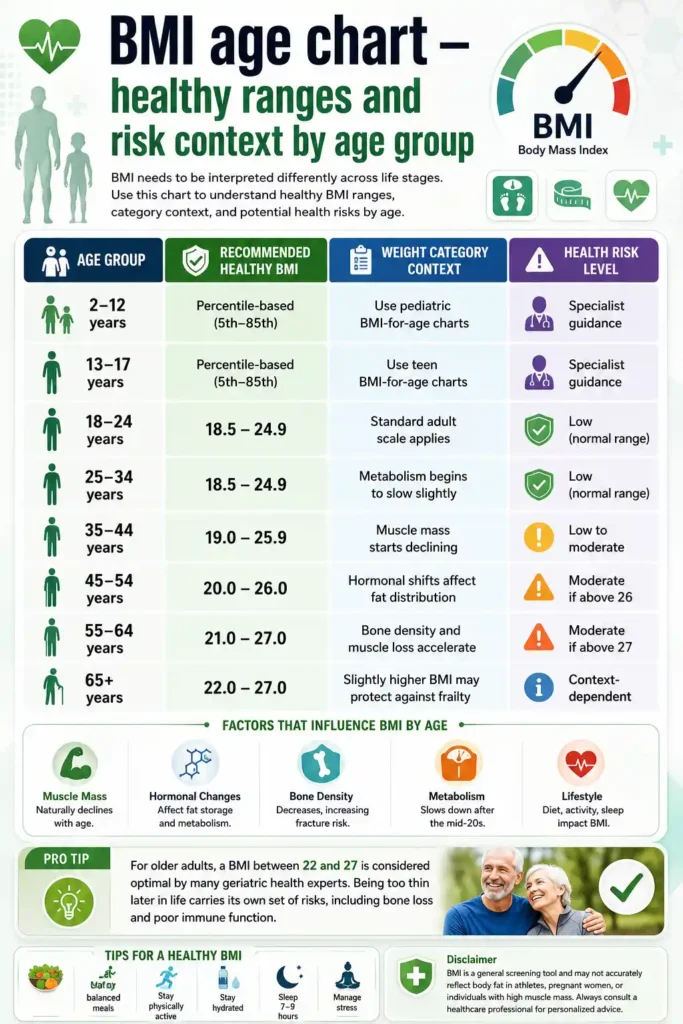
Healthy BMI Range by Age
Understanding the healthy BMI range by age helps you set realistic goals and interpret your results correctly. Your body genuinely changes at every stage of life, and those changes affect what BMI means for your health.
Children (Ages 2–12)
Children are never assessed using the same fixed BMI scale as adults. Instead, doctors use BMI-for-age percentile charts developed by the CDC and WHO. A healthy BMI for a child falls between the 5th and 85th percentile for their age and sex.
Children grow in spurts, so their BMI fluctuates naturally. A child with a BMI above the 95th percentile is considered obese by clinical standards. This matters because childhood obesity significantly increases the risk of developing type 2 diabetes, high blood pressure, and cardiovascular issues later in life. A Healthy Weight Guide specific to children can help parents track this properly.
Teenagers (Ages 13–17)
Teens also use age- and sex-specific BMI percentile charts. Adolescent bodies are growing rapidly and going through hormonal changes that affect weight distribution. A BMI in the 5th to 85th percentile is considered healthy for teenagers.
It’s common for teens to feel concerned about their weight during puberty. Rather than fixating on a number, the focus should be on balanced nutrition, regular physical activity, and healthy habits. The healthy BMI range by age for teenagers varies month to month and is best interpreted by a pediatrician.
Adults in Their 20s
For most people in their 20s, the standard adult BMI scale applies cleanly. A healthy BMI range of 18.5 to 24.9 works well for this group. Metabolism is generally at or near its peak, muscle mass tends to be higher, and the body responds well to diet and exercise changes.
That said, young adults should avoid using BMI alone to set fitness goals. Pairing it with a Body Fat Calculator or a BMR Calculator gives a fuller view. Tracking your Daily Calorie Intake alongside BMI is one of the most effective approaches at this age.
Adults in Their 30s
Most people notice a gradual metabolic shift in their 30s. The body burns slightly fewer calories at rest compared to the early 20s, and muscle mass can start to decline if exercise habits aren’t maintained. This is also when lifestyle factors like desk jobs, reduced sleep, and increased stress begin to influence weight more noticeably.
The healthy BMI range by age for people in their 30s remains 18.5 to 24.9 under standard guidelines. Staying within this range becomes more intentional rather than effortless. Using a Weight Loss Calculator alongside a structured Healthy Diet Plan helps manage this transition.
Adults in Their 40s
The 40s bring more significant body composition changes. Hormonal fluctuations begin to affect both men and women. Women approaching perimenopause often notice fat redistribution toward the abdominal area. Men experience a gradual decline in testosterone, which affects muscle maintenance and fat storage.
A healthy BMI range for people in their 40s is roughly 19 to 26. Keeping BMI within this window while preserving muscle mass through resistance training and adequate protein intake is the primary goal. A Calorie Calculator tailored to your activity level becomes especially useful here.
Adults in Their 50s
Menopause for women typically occurs during the 50s, bringing notable changes in fat distribution and energy expenditure. Men also experience declining androgen levels that continue to affect body composition. Both groups tend to lose lean muscle mass more rapidly if not actively countered through exercise.
For this age group, a healthy BMI range by age sits roughly between 20 and 27. A slightly higher BMI than the standard “normal” range can be appropriate, as long as excess fat isn’t concentrated around the abdomen. Waist circumference and the Waist to Height Ratio Calculator become more important measurements at this stage.
Adults Aged 60 and Older
For older adults, the healthy BMI range by age shifts upward compared to younger adults. Research published in multiple geriatric health journals suggests that a BMI between 22 and 27 is optimal for adults over 65. Being slightly heavier in later life can offer some protection against frailty, falls, and illness recovery.
Very low BMI in older adults is associated with malnutrition, reduced bone density, and weaker immune function. Very high BMI still carries risks including joint pain, cardiovascular strain, and reduced mobility. Regular Fitness Tips tailored to older adults, combined with routine BMI monitoring, support better long-term outcomes.
Why Age Matters in BMI Calculations
Using an age-specific approach to BMI isn’t just a refinement — it’s medically important. Here’s why the same BMI number means something different depending on your age.
Body Composition Changes Over Time
As people age, the ratio of fat to muscle in the body shifts. Even if your weight stays exactly the same from age 30 to age 60, your body likely holds more fat and less muscle at 60. This matters because muscle is metabolically active tissue, while excess fat — especially visceral fat around organs — is associated with inflammation and chronic disease.
Fat Distribution Shifts
Young adults tend to carry fat subcutaneously, meaning just beneath the skin. With age, fat increasingly migrates to visceral areas around the abdomen and organs. This visceral fat is far more metabolically harmful than subcutaneous fat, even at the same total body weight. So two people with identical BMIs at different ages may have very different health risk profiles.
Muscle Mass Loss (Sarcopenia)
After the age of 30, most adults lose roughly 3 to 5 percent of muscle mass per decade. This is called sarcopenia. As muscle decreases, body fat percentage rises passively — even without any change in weight or BMI. An Ideal Weight Calculator combined with body fat tracking can catch what BMI alone misses.
Bone Density Decline
Bone density peaks in early adulthood and gradually decreases after age 35, particularly in women after menopause. Lower bone density means less overall weight from the skeleton, which can make BMI appear slightly lower while body fat percentage is actually higher.
Metabolic Rate Slows
Basal metabolic rate (BMR) declines steadily with age. Fewer calories are burned at rest, making it easier to gain weight even without changes in diet or activity. A BMR Calculator helps quantify this shift so you can adjust your Daily Calorie Intake accordingly.
Limitations of BMI
BMI is a useful starting point, but it has real limitations. Understanding these helps you interpret your results more accurately.
Important Note
BMI is a screening tool, not a diagnostic test. A high or low BMI does not confirm a health problem — it signals that further assessment may be worthwhile.
Athletes and Muscular Individuals
Muscle weighs significantly more than fat by volume. A professional footballer, bodybuilder, or competitive swimmer may have a BMI in the “overweight” or even “obese” category while having extremely low body fat and excellent cardiovascular health. BMI simply cannot distinguish between fat mass and muscle mass. A Body Fat Calculator is far more informative for athletic individuals.
Older Adults
As covered earlier, older adults often have a higher body fat percentage at the same BMI as younger adults. A person aged 70 with a BMI of 24 may actually carry more fat than a 25-year-old with the same BMI. Age-adjusted interpretation is essential here.
Pregnancy
BMI is not an appropriate weight measure during pregnancy. Weight gain during pregnancy is expected and healthy. Pregnant women should work with their healthcare provider to monitor appropriate weight gain rather than relying on standard BMI ranges.
Ethnic Differences
Research has found that people of Asian descent tend to carry greater health risks at lower BMI values compared to people of European descent. Several countries have adjusted their BMI cutoffs accordingly for Asian populations, lowering the overweight threshold to 23 and the obese threshold to 27.5.
Short Stature
Individuals who are very short tend to get higher BMI readings relative to their actual health status. The formula’s mathematical structure slightly overestimates fatness in shorter people and underestimates it in very tall individuals.
Benefits of Using a BMI Calculator by Age
Using an age-specific BMI tool regularly offers several practical advantages over a generic calculator.
- More relevant results: Age-adjusted BMI ranges reflect real body composition changes, giving you context that a standard calculator skips entirely.
- Better weight management: Knowing your age-appropriate target range makes goal-setting more realistic and personally meaningful.
- Early health risk detection: Tracking BMI over months and years helps identify upward trends before they become health problems.
- Fitness progress tracking: When used alongside a Body Fat Calculator and Fitness Tips guide, BMI helps chart genuine physical improvements.
- Motivation and accountability: Seeing clear numbers can motivate positive lifestyle changes and make health goals feel concrete.
- Supports healthcare conversations: Having your BMI ready before doctor’s visits makes health discussions more productive and data-driven.
- Longitudinal tracking: Checking BMI consistently over years reveals patterns that single snapshots miss entirely.
Factors That Affect BMI
Multiple factors influence where your BMI falls, some of which are within your control and some of which are not.
Age
As discussed throughout this article, age drives significant changes in metabolism, muscle mass, and fat distribution. These changes naturally push BMI upward over the decades without changes in diet or exercise.
Sex
Men and women naturally differ in body composition. Women tend to carry a higher percentage of body fat at any given BMI, partly due to hormonal differences and partly due to reproductive biology. The standard BMI scale does not fully account for these sex-based differences, which is why some clinicians also use sex-specific BMI ranges.
Muscle Mass
As noted above, muscle is denser than fat. Highly muscular individuals register higher BMIs without excess body fat. Resistance training and high-protein diets help maintain muscle mass, especially as you age.
Genetics
Genetics influence metabolism, fat distribution patterns, and natural body shape. Some people are genetically predisposed to carry more weight in certain areas or to have slower metabolisms. Genetics are not destiny, but they do set a meaningful baseline.
Diet and Nutrition
Calorie intake and diet quality directly affect body weight. A Healthy Diet Plan focused on nutrient-dense whole foods supports maintaining a healthy BMI more sustainably than restrictive approaches. Tracking your Daily Calorie Intake gives you the most immediate lever to influence BMI.
Physical Activity
Regular exercise burns calories, builds muscle, and boosts metabolic rate. Both aerobic activity and strength training contribute to healthy weight management. People who are consistently active typically maintain lower BMI values with less dietary restriction.
Hormones
Thyroid function, insulin sensitivity, cortisol levels, and sex hormones all affect how the body stores and burns fat. Conditions like hypothyroidism, polycystic ovary syndrome (PCOS), and Cushing’s syndrome can cause weight gain that significantly affects BMI independent of diet and exercise behaviors.
Sleep and Stress
Poor sleep and chronic stress both elevate cortisol, which promotes fat storage — particularly around the abdomen. Adults who sleep fewer than six hours per night consistently show higher average BMIs in population studies.
How to Maintain a Healthy BMI
Achieving and maintaining a healthy BMI is a long-term process built on consistent, sustainable habits. Here are practical steps that work across all age groups.
- Eat mostly whole, unprocessed foods. Build meals around vegetables, lean proteins, legumes, whole grains, and healthy fats. These foods are nutrient-dense, filling, and far less calorie-dense than processed alternatives. A structured Healthy Diet Plan makes this easier to maintain consistently.
- Move your body every day. Aim for at least 150 minutes of moderate aerobic activity per week, plus two sessions of strength training. Daily movement — even walking — has a meaningful effect on BMI over time.
- Prioritize sleep quality. Aim for seven to nine hours of quality sleep each night. Poor sleep directly raises hunger hormones (ghrelin) and reduces satiety signals (leptin), making weight management significantly harder.
- Manage stress actively. Chronic stress raises cortisol, which promotes abdominal fat storage. Exercise, mindfulness, social connection, and time outdoors all help regulate the stress response.
- Stay hydrated throughout the day. Adequate water intake supports metabolism, reduces hunger, and helps the body process nutrients efficiently. Most adults benefit from 2 to 3 liters of water daily, depending on body size and activity level.
- Track your progress regularly. Use this BMI Calculator or a Weight Loss Calculator monthly to monitor trends. Consistent tracking helps you catch drift before it becomes a problem.
- Limit alcohol and ultra-processed foods. Both are high in empty calories and low in satiety. They are among the most consistent contributors to gradual weight gain in adults.
- Work with your doctor. If your BMI falls outside the healthy range despite lifestyle changes, discuss it with your healthcare provider. Hormonal issues, medications, and other clinical factors may be involved.
Related Health Tools
For a complete health picture, use our BMI Calculator alongside the Calorie Calculator, Ideal Weight Calculator, Body Fat Calculator, and BMR Calculator. Track your Daily Calorie Intake, follow a Healthy Diet Plan, and check your Waist to Height Ratio Calculator for abdominal health. The Weight Loss Calculator and Fitness Tips guide are excellent next steps after reviewing your results.
FAQs
Conclusion
BMI is one of the most accessible health tools available, but it works best when used with age in mind. A BMI calculator by age gives you context that a basic calculator cannot — helping you understand whether your number is genuinely cause for concern or simply reflecting the natural changes your body goes through over the decades.
The healthy BMI range by age shifts as you grow older. What’s considered optimal at 25 is not identical to what’s optimal at 65. Children and teenagers need percentile-based assessments altogether. Understanding these nuances helps you set realistic goals and make meaningful health decisions rather than chasing arbitrary numbers.
Use the calculator on this page regularly — but pair it with a Body Fat Calculator, a Calorie Calculator, and honest conversations with your healthcare provider. BMI is a starting point, not a verdict. Combined with healthy eating, consistent exercise, adequate sleep, and stress management, keeping track of your BMI by age is one of the simplest and most effective ways to stay aware of your overall health trajectory.
Check back in a month. Track your trend. Stay consistent. Your health goals are worth it.
ℹ️Medical Disclaimer: This calculator is for informational purposes only and does not replace professional medical advice. Always consult a qualified healthcare professional for diagnosis, treatment, or any health-related decisions. BMI is a screening tool and should not be interpreted as a definitive health assessment.